GCP Stackdriver Monitoring (現名 Cloud Monitoring)有許多預設的 metrics 可供使用者監控並產生告警。但有時使用者希望能夠自訂特殊的 metrics 來監控,這時就可以透過 Log-based metrics 來設定。此教學將手把手帶您設定 Log-based metrics 告警。
假設情境
假設 VM 裡面有運行很多服務,例如 Nginx, MySQL 等等。已經有自動化腳本在監控這些服務的狀態,而且腳本會將服務狀態寫入本機檔案,例如 nginx-status.txt、mysql-status.txt 等。
- 備註 1:本機狀態檔案內容會有多筆紀錄,新狀態是 append 不是 overwrite 寫入狀態檔案。
- 備註 2:本機狀態檔案內容是一直數值,例如:0, 1, 2 之類。
使用者可以在 VM 裡面安裝 Stackdriver logging agent,透過 agent 將本機服務狀態檔案內容寫入 Stackdriver,然後透過以下步驟設定 log-based metric alert 在 payload 內容 > N 時發出告警。
手把手教學
此教學使用 debian 9 為範例,假如是其他 OS version 可以參考文件。
Step 1:
Compute Engine > VM instances 並點選 SSH 按鈕 SSH至 VM 當中,並執行以下指令來安裝 Stackdriver logging agent


curl -sSO “https://dl.google.com/cloudagents/install-logging-agent.sh”
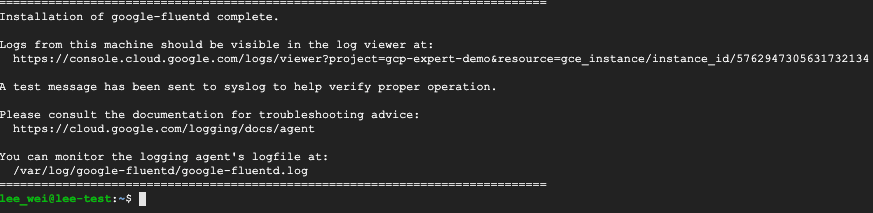
sudo bash install-logging-agent.sh
執行完畢會出現下圖

touch /tmp/nginx-status-code.log
Step 3:
產生一個設定檔案,例如 /etc/google-fluentd/config.d/nginx-status-code.conf
sudo vim /etc/google-fluentd/config.d/nginx-status-code.conf
貼上以下內容:
<source>
    @type tail
    # Format 'none' indicates the log is unstructured (text).
    format none
    # The path of the log file.
    path /tmp/nginx-status-code.log
    # The path of the position file that records where in the log file
    # we have processed already. This is useful when the agent
    # restarts.
    pos_file /var/lib/google-fluentd/pos/nginx-status-code.pos
    read_from_head true
    # The log tag for this log input.
    tag nginx-status-code
</source>
查看是否有成功寫入
sudo cat /etc/google-fluentd/config.d/nginx-status-code.conf

Step 4:
重新啟動 logging agent
sudo service google-fluentd restart
確認重啟後的 Status
sudo service google-fluentd status
Step 5:
創建一個 start.sh 檔案寫入測試資料到狀態檔案,例如每五秒更新一次狀態(範例腳本用時間的秒當作狀態碼)
vim /tmp/start.sh
貼入以下內容
#!/bin/bash
while [ true ];
do
    date
    date +%S >> /tmp/nginx-status-code.log
    sleep 5
done
執行 start.sh
bash /tmp/start.sh

查看 nginx-status-code
cat /tmp/nginx-status-code.log

Step 6:
前往 Stackdriver Logging > Log Viewer,並點選右手邊的 Advanced Filter:


填入以下內容

resource.type="gce_instance"
resource.labels.instance_id="[INSTANCE_ID]"
logName="projects/[PROJECT_ID]/logs/nginx-status-code"
textPayload>30
點選 Submit 就會出現我們產生的 Log,payload > 30 就產生指標

點選左上角的 Create Metric

右方填入 Metric 名稱以及描述,點選 Create Metrics 建立。

Step 7:
Logging > Log-Based Metrics 設定 Alert

找到剛剛新建的 nginx-status-code metric 點選右邊的 Create alert from metric

填入相關參數,點選 SAVE
[ Target ]
Resource Type = 不要選!不要選!不要選!
Metric = nginx-status-code
Aggregator = count
[ Configuration ]
Condition triggers if = Any time series violates
Condition = is above
Threshold = 0
For = most recent value

SAVE 之後會顯示剛剛設定的 Alert Condition

拉到視窗的最下方填入 Policy Name 點選 SAVE 即完成創建 Alert
